The studies took place in a lab with a size of 16 square meter, equipped with a large round table, several chairs, a large screen on the wall, one laptop mounted on a stand, speakers and an audio recording device.
The approach to the evaluation of the prototypes was an intrusive evaluation, "where the user’s normal behavior is consciously disrupted by the evaluation experiment", as described in the paper "Intrusive and Non-intrusive Evaluation of Ambient Displays" by Xiaobin Shen, Peter Eades, Seokhee Hong and Andrew Vande Moere.
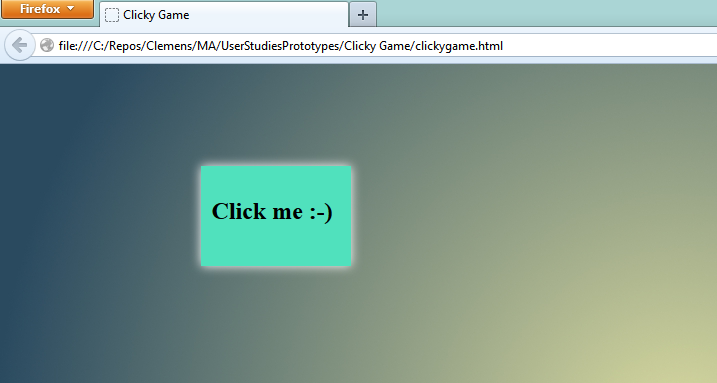
The primary task consisted of a simple mouse clicking game, where the user had to follow a box on the screen and click it. The amount of clicks every 10 seconds had been recorded to have a unit to measure the user's performance. While executing this task, users had to monitor four different metrics that where represented in different ways:
- visual representation only
- sound alarms only
- sound alarms and metric audification
Every time, one of the metrics exceeded a particular threshold, users had to interrupt their primary task and switch to the other screen to resolve the issue (by clicking a appearing button).
The visual only data representation of the four metrics was represented on the large screen mounted to one of the walls of the lab. The screen was clearly visible from the position. Once a metric exceeded a particular threshold, a large red bubble would appear on the screen. Additionally, all four metrics where visualized by a bar chart.


The "sound alarms and metric audification" approach contained the alarming noise as well as four different wave and noise generator mapped to the four values. Through that, users could constantly hear the values and the value's changing.
Every user went through two of these three settings after a short warm up with the application. The sound approaches where always prior to the visual only approaches.

In the second setup, several different auditory icons and earcons where played. Users had to decide for each alarm sound what context it might inherit. There where four different solutions:
Every user went through two of these three settings after a short warm up with the application. The sound approaches where always prior to the visual only approaches.
In the second setup, several different auditory icons and earcons where played. Users had to decide for each alarm sound what context it might inherit. There where four different solutions:
- Data In
- Data out
- Process Step Complete
- Process Step Failed
Different design approaches have been tested and evaluated through this method.
After interacting with the prototypes, users have been questioned during an interview about their experience.
References
Shen, X., Eades, P., Hong, S. and Vande Moere, A. 2007. "Intrusive and Non-intrusive Evaluation of Ambient Displays", paper presented at Pervasive '07 Workshop, Toronto, Ontario, Canada, 13 May. Toronto, Ontario, Canada: Pervasive '07 Workshop: W9 - Ambient Information Systems.
No comments:
Post a Comment