Tuesday, May 26, 2015

Final Project

I'm happy to post (very late) that this Master project had successfully completed in March 2014 and has been given a First Class Honours.

The abstract, table of contents and introductory chapter of the thesis is below. If you're interested in full thesis, please let me know and I will send it to you! Also very excited to hear any comments or feedback on the project!


LISTENING TO THE HEART OF BUSINESS

by Clemens Anzmann at the DataShaka Ltd. office  


  1. Introduction

  2. Ambient Auditory Displays

    1. Definitions
      1. Sonification
      2. Ambient Display
    2. Taxonomy and Dimensions
    3. Related Projects
  3. Concept

    1. Metric Classification and Manipulation
    2. Sound Design
  4. Implementation and Evaluation

    1. Technical Research
    2. Company Internal Research
    3. User Studies
      1. Intrusive User Studies
      2. Non-Intrusive User Studies
        1. Observational Methods
        2. Reports and Evaluation
    4. Retrospective
  5. Outlook and Conclusion

  6. References


Abstract

Every business today generates data through its everyday processes. The look of this data might vary, depending on the nature of the company. However, they all equally produce data. This data can, if used correctly, provide valuable information and crucially support important decision making. In fact, no decision should be made and no action should be taken that is not data driven or justifiable and backed up with data. This is commonly achieved through the continuous tracking of all business metrics and their retrospective analysis. A different approach is to continuously observe these metrics in real time, to gain a constant awareness on their development and the ability to take quicker action when necessary. The main goal of the “Listening to the Heart of Business” project was to develop and evaluate techniques and applications that produce ambient data sonification to provide non-disruptive data monitoring of business relevant data inside a working environment. Office workers should only be distracted from their main task when critical events occur. The “Listening to the Heart of Business” project states that the use of ambient auditory displays will enable companies to subtly stay on top of their data as well as empower them to take immediate action a lot faster when necessary. The hypothesis, ambient sonification would not add value to the awareness of business relevant metrics has been challenged through research in the fields of ambient displays and auditory displays as well as several user studies and their evaluation, including the implementation and evaluation of an auditory display inside a working environment. All research has been conducted at the DataShaka Ltd. office in London.

1. Introduction

Today’s companies are facing classic big data problems when trying to observe and evaluate their internal data. With the ability to track almost everything that is happening inside and outside the company, people are lacking tools to observe all these relevant metrics for continuous awareness and faster data driven decision making. The three major challenges in big data (also commonly known as the three V’s) are volume, velocity and variety [25]. Regarding the growing amount and accelerating shifts in internal and external metrics, it is especially the problem of volume and velocity that businesses have to cope with. With the overwhelming amount of data that can have a potential impact on the business, the desire to act proactively is challenged as these large amounts of data can only be consumed retrospectively.  
Particular data representation devices that addresses the problematic of information overload are so called ambient displays. Ambient displays destruct data to its most basic information to transmit this information in ways that can be subtly perceived by its observer. A common example for ambient displays are lights that are smoothly changing colour or intensity in relation to the data stream they represent. The major goal of ambient displays is to minimize the mental effort of the observer to monitor the data stream and present data in a non-disruptive way. 
For situations where it is not convenient for the observer to be continuously distracted by a visual display, auditory displays are a suitable solution to provide information without the necessity of visually focusing on a particular artefact, as “unlike visual perception, perception of sound does not require the listener to be oriented in a particular direction.” [22] Most current practical applications of auditory displays for these situations use a classic alarm-focussed approach and often trigger highly disruptive sounds.

A classic example for these types of auditory displays deployed for such use cases are alarms in stores triggered by a sensor that identifies stolen items. Disruptive auditory alarms can also be found in pilot cockpits, signalling critical values of several instruments. Furthermore, a common deployment of auditory displays is found in hospitals for the continuous observation of vital signs of numerous patients. Usually, the loudspeakers and sounds are specifically designed to make a strong noise audible on very sensitive frequencies. 
When looking at current problems and needs companies are facing due to their high data volume and velocity and comparing it to the use cases ambient and auditory displays are trying to solve, it appears that ambient displays and auditory displays both address and potentially satisfy different aspects of these needs. To elaborate and present their potential for this use case, the following research project investigates ambient and auditory displays and their effective use in working environments to enable company personnel to have a permanent awareness over business developments without being distracted from their everyday work. It furthermore investigates the term “Ambient Auditory Display” and proposes a taxonomy. User studies and a live deployment of a prototype in a working environment have been conducted. The prototype has been evaluated in regards to the proposed taxonomy. Evaluations and conclusions have been conducted after the successful completion of all user studies. 
To structure the limited research time and define goals and deadlines for the research period (September 2013 until February 2014), a detailed Gantt chart had previously been created. The outlined strategy on the chart had been evaluated and restructured continuously and went through different iterations during the research period. The following paragraphs presents the final version of the Gantt chart that can be found in appendix A.

During the first month, completing the technical research to produce potential sonification prototypes and create initial sketches and tests have been the main focus. At the end of the second month, a preliminary sonification prototype created from these sketches was planned to be ready and able to process and present a data stream. Simultaneously, it was planned to conduct all necessary theoretical research within the first two months. During the third month, user studies had been scheduled. Evaluating and structuring all results was timed to be completed by the end of the month, so the development of a second prototype respecting all results from the previous user studies could be started. During December, this new prototype was scheduled to be deployed in a live working environment, to be evaluated at the end of the month. The completion of the presentation and writings of all the noted results from both user studies in the written documentation was set for the end of January. Additional stretch goals had been defined for each month. 
All research has been conducted at the DataShaka office in London. DataShaka Ltd. is a data unification platform specialised to solve the variety problem in big data. As the volume problem has become manageable with decreasing prices for digital storages, variety is now a major problem in big data and companies have strong desires to be able to have all data in one place. All internal and external business relevant data comes in various different formats and all datasets are structured differently, depending on their content. DataShaka is solving this problem for their clients by harvesting and unifying all of their client’s data in an agile data format. Many internal metrics exist, that require observation and attention by employees of DataShaka. Ambient auditory display prototypes have been evaluated, by testing and deploying them inside the DataShaka office. Data from occurring events, feedback as well as scheduled interviews with DataShaka personnel has been gathered for additional evaluation.

The following body of work presents the research project “Listening to the heart of business” and its results. In chapter 2, definitions for the terms ambient display, auditory display and data sonification are derived and a taxonomy is proposed for the term “Ambient Auditory Display”, combining the attributes of these data representation approaches. Related projects are investigated and compared. Chapter 3 describes ways to simplify and extract valuable information from raw company metrics. Furthermore, sound design approaches for data sonification are discussed. Further on, chapter 4 presents all user studies that have taken place during the research period. Technical research in the area of data sonification achieved through online applications using JavaScript libraries is propounded. A detailed description, report and evaluation of all user studies is further presented and future research paths are being discussed. 

Tuesday, December 3, 2013

A research paper by NASA about Data Sonification

A research paper by NASA about data sonification and its use in the practical field has been studied for further insight into sonification applications in different research areas.
It describes sonification as a tool that "can improve and increase the bandwidth of the interface 'human-computer' and can find a lot of applications in the wide range of information technology."

Furthermore, the strengths and possible features of sonifcation are being pointed out:
  • "uncovering patterns masked in visual displays
  • identify new phenomena current display techniques miss
  • improving data exploration of large multi-dimensianal and multi-dataset
  • exploring in frequency rather than spatial dimension
  • analyzing complex, rapidly, or temporally changing data
  • complementing existing visual displays
  • monitoring data while looking at something else (background event finding)
  • improving visual perception when accompanied by audio cues"
Background event finding would be the most relevant use case for the Listening to the Heart of Business research project.

In the introductory chapter, the papers provides a very detailed research history of the field of Sonification and points out very interesting early works in this field from the following authors:

  • Pollack, I., and L. Ficks. “Information of Elementary MultidimensionalAuditory Display”. J.Acoustic SocietyAmerica (1954)
  • Speeth, S. D. “Seismometer Sounds”. J.Acoustic SocietyAmerica (1961)
  • Chambers, J. M., M. V. Mathews, and F. R. Moore. “Auditory Data Inspection”. Technical Momorandum no. 74-1214-20,AT&T Bell Laboratories (1974) 
  • EdwardYeung, “Auditory Display”. Santa Fe Institute (1994)

Further in the paper, the application xSonify is introduced and explained in much detail and how it can be used for successful data sonfications. The software provides different sonification modi and instruments, also including speech support for blind people. Different data sets can be imported into the application and mapped to different sonification techniques and instruments. After setting everything up, the user hits the play button and can listen to the data. xSonify is one of the most famous sonification applications.

Towards the end, a very interesting piece of work by Sylvain Daude and Laurence Nigay is presented, introducing a sonification process and its data transformation within (from Sylvain Daude, Laurence Nigay, “Design Process For Auditory Interfaces”, Proceedings ICAD 2003).

From Data To Data View: Data Transformation 
(...) the raw data will be mapped value by value into a range of values between0 < x < 1. This process can be considered as a kind of standardization of values whichis necessary to make the data available independent from their unit and scale.
 From Data To Abstract Sound Space: Sonification Transformation
(...) the data are prepared according to the chosen Sonification modus. Every value will be assigned to a certain position at a “time line”. This “time line” isrepresents the time line of the Sonification sequence which will be played (...).

FromAbstract Sound Space To Sonic: Auditory Display Transformation 
(...) where the signal is finally displayed on a physical device.


The picture below visualizes the transformation of the data's journey from raw data to sound.

Sonification Process from the NASA Sonification Paper


At the end of the paper, difficulties and problems regarding sonification are being pointed out:
• low resolution of some auditory variables
• limited spatial precision 
• lack of absolute values 
• absence of persistence 
• no printout

More about NASA's research on sonification can be found here. 

Thursday, November 28, 2013

Choir.io

"Listing to the Heart of Business" tries to find ways to give businesses a peripheral awareness over their data. Chior.io is a project that takes a very similar approach of presenting continuous data flows:

Chior.io is a web based service to allow to monitor processes acoustically, to provide "ambient awareness  without effort" [1]. Through an API, events can be streamed to the service which turns those events into sound. Defining those events happens by the user in the back end. Different languages are documented to send events to chior.io, such as Shell languages, Python, Ruby, Node.Js, PHP, C#, Java and Clojure. The resulting sonification is available online and therefore can be accessed from any machine. 

The sound design is given by chior.io and specifies three different event types: good, neutral and bad. Two different sound sets are available ("submarine" & "bloob"). 


Sounds available for the three emotions given by choir.io


It seems that individual sound design is not yet possible to implement. All auditory events appear to be static and sound icons don't seem to be able to change dynamically to an events' severeness. Hence, all events are technically treated as binary events. 

An impressive example and prove of concept is available on the project's website: A live sonification of GitHub events.

GitHub events sonification by choir.io


References

1. Choir.io. 2013. Choir.io. [online] Available at: http://choir.io/ [Accessed: 28 Nov 2013].

Tuesday, November 26, 2013

Interview with a DevOps

An interview with the person responsible for DevOps has taken place at the DataShaka office.

Main questions during the interview where what the term DevOps means, how it is related to the agile movement, how it is different from classic operations and what are the tools currently available.

One topic during the interview was the agile moving, where the term DevOps emerged from. One major drive in the agile movement was to bring developers closer to people, rather than having them isolated inside the company. Similarly, the DevOps movement intends to bring developers and operations closer, as both departments used to be quite separate. In larger companies, entire DevOps teams are now responsible to link development and operations together (also see previous blog post here).

Software being used by operations or DevOps have been mentioned:
  • Etsy
  • Stats D
  • DataDog
  • SNMP
A term mentioned very often during the interview was "pro-active". It is important for a person responsible for DevOps, to be pro-active rather than re-active. This means specifically, to be able to interfere before something breaks and to be able to act with hindsight. Practically (and already in acoustically) speaking, it means reacting early to strange noises rather than to the alarm noise, when it is already too late.

There seems to be a lot of interesting history about operations and it appears that this field of work is still facing similar problems as it used to have in the past. With the ability to monitor all the things simultaneously in real-time, operations is facing classic big data problems, such as volume and/or velocity. Additionally, operations as well as DevOps departments want to be able to act pro-actively, interfere before things breach and provide a non-disruptive service. With the rising amount of data, this desire is challenged by what is often referred to as the "bandwidth problem". Not resolving this problem, will ultimately this hinder scaling. And therefore, better tools will be needed for DevOps departments.

The content and information received during this interview has been of very high value for the research project as the challenges faced by the DevOps sector match entirely with what the "Listening to the Heart of Business" project is trying to solve: Being able to be on top of a large amount of metrics with minimal disturbance of your primary task.

---------------------------------------------------------------------------

Below can be find excerpts from the interview that have been found as particularly valuable:

"DevOps introduced a numbers of new tools, processes and operations bringing operations into the twenty-first century"

"[It's about] making sure things are pro-active, not re-active"

"monitor everything"

"People have an expectation now, that things will just work all the time. That means you need to be an top a lot more."

"You need to be able monitor a lot of things at one time with through a limited amount of real estate."

"We can see broad brushes, we can see if something broken or if something stopped, but actually getting this pro-activity of 'is it operating well, how is operating' is difficult, because the bandwidth is lower."

"You might have an ambient display for temperature alarm. (...) You wouldn't have an ambient display for a fire alarm. (...) A fire alarm is designed to disrupt you."

"People don't make enough use of non-disruptive monitoring. That's what pro-activity is about. (...) Pro-activity is the understanding and having the nuance to be able to dig into what's happening before it's a problem and before it's breaching."

"It's also a scaling problem. You suddenly got that need to monitor much more than you're able to perceive. You need to be on top of an awful lot of stuff. And that's when people start to look into different ways of data presentation rather than purely a number. What can we do to help increase that leverage? For large organisations, it's about being able to get that higher bandwidth."
"The ingenuity of human brains and look at a problem and find a lateral solution is always going to be involved. What it is is about giving humans better tools."

Wednesday, November 20, 2013

User Studies Data Analysis

The data collected from the first user study has been harvested and analysed. First thing that comes to eye is, that there do not appear to be many clear differences in the data and it will be difficult to extract valuable information or conclusions, due to the fairly small sample size.

Initially, the performance over time while keeping track of moving metrics has been examined. When comparing the average performance of users working with the visual only approach to the sound approaches, no clear performance increase can be identified. There appear to be performance differences between users working with the "sound alarm only" and the "sound alarm and audification" approach. However, the small sample size does not allow to draw a solid conclusion from this.


In all cases, the performance decreased in a fairly similar amount when an event occurred. Though there where performance differences between each user, the average performance decrease while fixing events was fairly consistent. A notable issue in the data is however, that performances with the visual approach showed a  more consistent performance whereas the audio approaches showed more fluctuations.

A non-intrusive evaluation with a similar prototype installed in a live office environment is planned. This way, the factor time and surprise would take a larger role, as users would not constantly expect event to occur and fully concentrate on their primary task.


In the context identifying tests of auditory alarms, artificial sound design approaches appeared to be clearly more identifiable then recordings of natural sounds. 16 different sound alarms where triggered, eight of them being natural and the other eight being artificially created sounds.

Amount of users guessing context correctly for each context type separated by natural and artificial sounds


Artificial sounds appeared to be more familiar to users whereas natural sounds often caused surprise, confusion or where sometimes completely ignored. 76% of the artificial sounds where referred correctly to what the sound designer intended the sound to represent, whereas only 24% of the naturally recorded sound's context was identified.


This outcome is very insightful and will be further investigated. The focus on further investigations will lie on artificial sounds and different techniques how to transport context.


The analysis of transcript of the interviews is still work in progress.

Sunday, November 17, 2013

DevOps

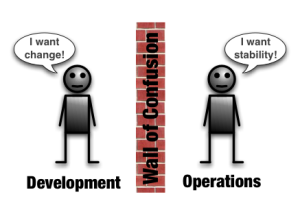
"DevOps is a response to the growing awareness that there is a disconnect between what is traditionally considered development activity and what is traditionally considered operations activity. This disconnect often manifests itself as conflict and inefficiency."
-- Damon Edwards, "What is DevOps?" [1]

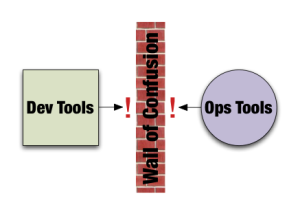
In agile business environments, DevOps teams are often responsible to ensure change and stability, and most importantly deal with the conflict that lies within those two areas. The term DevOps is put together from the two terms "Development" and "Operation", which are two classic departments in software companies. Development is responsible for all amendments, bug fixes and constant further development of the software. Operations is responsible for the software's stability. Both departments have interest that often conflict. The area around DevOps is supposed to solve this conflict and bring back agility to the static and sluggish current "Development - Operations" structure, which is continuously blocking itself.

Image from Dev2Ops.org

To ensure constant stability without constantly being distracted with monitoring and still being able to remain agile and open to change, new ways of metric measurements are necessary. 
Therefore, a major part of the DevOps movement is related to metric monitoring of so called KPIs (Key Metric Indicators) [3].
Ambient displays and Auditory Displays inherit potential to benefit for DevOps teams, as they provide a constant peripheral awareness of important metrics but are not necessarily a continuous distraction. 
DevOps is an area the research project could make a major contribution to and it proves to be a potential use case for the deployment of an ambient auditory display.


Image from Dev2Ops.org

Further research will be conducted through organizing an interview with the person responsible for Lead DevOps at the DataShaka office. After the evaluating the interview, installing an ambient auditory display triggering subtle sound events will be the next priority. Its impact on employees, operations and development as well as the office space in total will be evaluated.


References:


  1. dev2ops. 2013. What is DevOps? - dev2ops. [online] Available at: http://dev2ops.org/2010/02/what-is-devops [Accessed: 17 Nov 2013].
  2. Hüttermann, M. 2012. DevOps for developers. [New York]: Apress.
  3. Reh, F. 2013. Key Performance Indicators or KPI. [online] Available at: http://management.about.com/cs/generalmanagement/a/keyperfindic.htm [Accessed: 17 Nov 2013].

Wednesday, November 13, 2013

First User Study Session

The first user study has been conducted at the DataShaka office. Six individuals have been tested using two different prototypes with different settings while executing a primary task. The user group consisted of five male and one female person between 27 and 49 years of age. All reported normal hearing abilities. All participants work with computers on a daily basis on a similar amount of time.

The studies took place in a lab with a size of 16 square meter, equipped with a large round table, several chairs, a large screen on the wall, one laptop mounted on a stand, speakers and an audio recording device.

The approach to the evaluation of the prototypes was an intrusive evaluation, "where the user’s normal behavior is consciously disrupted by the evaluation experiment", as described in the  paper "Intrusive and Non-intrusive Evaluation of Ambient Displays" by Xiaobin Shen, Peter Eades, Seokhee Hong and Andrew Vande Moere.

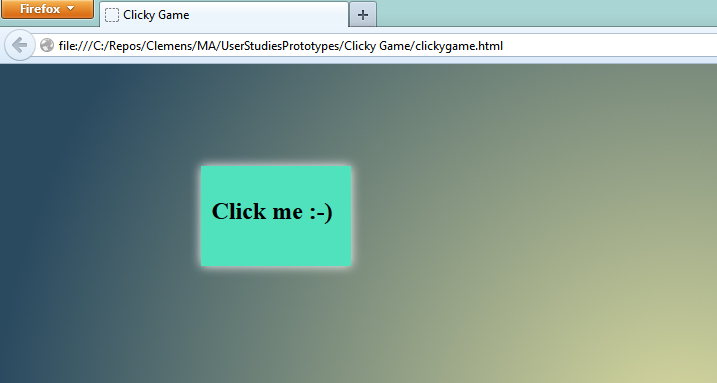
The primary task consisted of a simple mouse clicking game, where the user had to follow a box on the screen and click it. The amount of clicks every 10 seconds had been recorded to have a unit to measure the user's performance. While executing this task, users had to monitor four different metrics that where represented in different ways:
  • visual representation only
  • sound alarms only
  • sound alarms and metric audification
Every time, one of the metrics exceeded a particular threshold, users had to interrupt their primary task and switch to the other screen to resolve the issue (by clicking a appearing button).


The visual only data representation of the four metrics was represented on the large screen mounted to one of the walls of the lab. The screen was clearly visible from the position. Once a metric exceeded a particular threshold, a large red bubble would appear on the screen. Additionally, all four metrics where visualized by a bar chart.

The "sound alarms only" approach would only trigger a alarming noise once a value exceeded a particular threshold.

The "sound alarms and metric audification" approach contained the alarming noise as well as four different wave and noise generator mapped to the four values. Through that, users could constantly hear the values and the value's changing.

Every user went through two of these three settings after a short warm up with the application. The sound approaches where always prior to the visual only approaches.


In the second setup, several different auditory icons and earcons where played. Users had to decide for each alarm sound what context it might inherit. There where four different solutions:
  • Data In
  • Data out
  • Process Step Complete
  • Process Step Failed
Different design approaches have been tested and evaluated through this method.

After interacting with the prototypes, users have been questioned during an interview about their experience.


References

Shen, X., Eades, P., Hong, S. and Vande Moere, A. 2007. "Intrusive and Non-intrusive Evaluation of Ambient Displays", paper presented at Pervasive '07 Workshop, Toronto, Ontario, Canada, 13 May. Toronto, Ontario, Canada: Pervasive '07 Workshop: W9 - Ambient Information Systems.

Thursday, November 7, 2013

Table of Contents

A preliminary table of contents for the written thesis has been created:

_________________________________________________

  1. Abtract
  2. Introduction
    1. Project Description
    2. Goals
    3. Summarize Thesis
  3. Sonification
    1. Definition
    2. Techniques
  4. Ambient Display
    1. Definition
    2. Calm Technology
  5. Ambient Sonification
    1. Introduce
    2. Taxonomy and Dimensions
  6. Related Project
  7. DevOps
    1. What is DevOps
    2. Agile
    3. Challenges
  8. Data and Metrics
    1. Classification
    2. Time Series Data
    3. Agregation
  9. Sound Design
  10. The Heart of Business
    1. Project Idea and explanation
    2. Approach
    3. Research
    4. User Studies
    5. Evaluation
    6. Live Implementation
    7. Evaluation
  11. Discussion
  12. Conclusion


Wednesday, November 6, 2013

User Studies Procedure

Now that the goals of the user studies are defined, the procedure, tasks and content of the user studies is created to achieve these goals.

The studies will consist of three parts per person:
  • Sonification versus Visualization
  • Transporting Context through Sonification
  • Interview
In the first step, the user will perform a basic task on a notebook while the amount of clicks per minute/second is recorded. A large screen in the room displays a constant data stream visualized through a bar chart. Another data stream is sonified through parameter mapping. When one of those streams exceed a certain threshold an event will be triggered, either visually or audible. Once an event occurs, the user has to interrupt the primary task and respond to the event.
The user will be given the option to switch off the parameter mapping or sound icons. How many users chose to actively mute one of the sounds and especially which one of those two sounds will be part of the evaluation.
Furthermore, the reaction time differences and the impact on the primary task will be evaluated. The amount of data streams for visual and audio representation will increase over time. That way, the maximal bandwidth of user for audio and visual data representation can be determined and compared. It has yet to be decided, weather the audio and visual test will be held separately or  in combination by having both merged into on test.

In the second step, the setup of the previous test remains. The large screen however won't be showing any visualizations and only audio will be played. The user has to perform a simple task while events occur, being represented through different earcons and auditory icons. Various approaches will be tested to transport context through these notifications, as the user has to guess the context around the event that happened.
Zachary Pousman and John Stasko identified four different semiotic approaches to information representation design for ambient displays in their work "A Taxonomy of Ambient Information Systems: Four Patterns of Design": indexical, iconic and symbolic. Symbolic signs are signs that have to be learned and cannot be understood immediately. Iconic signs are more insightful and could be identified at a glance as the way they are presented is clearly connected to what they stand for. Indexical signs are directly connected to their signified item, such as a photography of signified item. All three semiotic approaches will be tested to investigate and evaluate their effectiveness of transporting context cues through sound.
There are only four different events that can occur and the user only has to decide, which one it is. Through the different amounts of accuracy, the different semiotic sonification approaches can be evaluated.
Furthermore, this study will try to investigate ways to combine auditory icons and earcons in a meaningful way. As pointed out in the chapter "Earcons" by David McGookin and Stephen Brewster in the Sonifcation Handbook, "less work has been carried out to see how they can be best combined within an interface."

After those two tests, the user will be interviewed to gain knowledge about the entire experience and user feedback. Main points during this interview are a.o. fatigue, disturbance or annoyance.


Sunday, October 27, 2013

Audio Aura

The work "Audio Aura" is an ambient sonfication installation inside an office space. It is designed "to provide serendipitous information via background auditory cues, that is tied to people’s physical actions in the workplace"[1]. Metrics gathered through various sensors (e.g. infrared tracking of people inside the office) are being turned into an ambient soundscape to give workers inside that space a constant overview of what is going on inside the office space and the business.

Though "Audio Aura" focuses more on the actual physical office space, rather than internal business and process metrics, it still very closely related to the research and work for the "Listening to the Heart of Business" master project. A lot can be learned from the conducted research of the "Audio Aura" project and their results and take aways should be highly considered during the creation of prototypes.

The following three quotes have been particularly seen as important. Those learnings about sound design for such a particular system must not be ignored and have to be kept in mind while creating the intended soundscape that will be implemented inside the DataShaka office space:
"Because we intend this system for background interaction, the design of the auditory cues must avoid the “alarm” paradigm so frequently found in computational environments." [1]

"Another idea (...) is imbedding cues into a running, low-level soundtrack, so that the user is not startled by the sudden impingement of a sound. The running track  itself carries information about global levels of activity (...). This “group pulse” sound forms a bed within which other auditory information can  lie." [1]

"One useful aspect of the ecological approach to sound design is considering frequency bandwidth and human perception as limited resources." [1]


Furthermore, two interesting sources are mentioned that will be further investigated:

  • I&ii, H. and Ullmer, B., (1997) “Tangible Bits: Towards Seamless Interfaces between People, Bits, and Atoms,” in Proceedings of CHl’97, ACM, March 1997.
  • Weiser, M. (1991) The Computer of the 21st Century. Scientific American 265(3):94-104.

Sources:

D. Mynutt, E., Back, M.,, Want, R., Palo, X., Baer, M., B. Elli, J., "Designing Audio Aura", Alto Research Centre, University of Stanford, Gorgia Institute of Technology, 1998 

Wednesday, October 23, 2013

Gantt Chart Update

While catching up with the initial Gantt Chart, it turns out that some changes are necessary to respond to the current status of the project. As suggested by the project's supervisors, more time has been reserved for initial research and theoretical work. Therefore, the "Structuring Research & Hypothesis" and "Writing" activity have been moved forward by two weeks. Additionally, the monthly goals had to be restructured. "Live Data & App hosted online" has been moved to December and "Prototype II & DISQ implemented" has been canned.


The main focus still lies on having a good user studies session in November, as the outcome will be essential for the written thesis. While evaluating the results from those user studies and writing the thesis, the goal for December is now to implement the evaluated prototype inside the office and observe how employees react to it.

Below is the updated Gantt Chart for the project.


Monday, October 21, 2013

What do I want to know?

Before starting the user studies and going into deeper organisation and prototyping, it is the most important thing to make clear what one wants to know and what the desired knowledge is, that is supposed to alight from these studies. During a quick brainstorm, these were the initial questions and metrics of interest, that could be monitored and evaluated during those studies:

The User's
  • performance 
  • action
  • reaction 
  • monitoring bandwidth 
_______________________________________________
  • while executing an unrelated task
  • for different use cases/"data-stories"
  • for different sound design approaches
_______________________________________________
  • get user experience feedback on 
    • fatigue
    • transition
    • notification level
    • disturbance
    • annoyance


The Sonification Handbook mentions a lot of areas that still lack documented researching. The following paragraphs are the ones that seemed mostly related to the thesis:

Chapter 2
Theory of Sonification
Bruce N. Walker and Michael A. Nees

"Surprisingly few studies to date have considered how the addition of a secondary task affects performance with sonifications." (Page 21)
"The successful deployment of sonifications in real-world settings will require a more solid base of knowledge regarding these issues." (Page 22)
"Researchers have only scratched the surface of possible context cues and their configurations, and we need to implement and validate other, perhaps more effective, methods (see, e.g., Nees & Walker, 2006)." (Page 26)

Chapter 14
Earcons
David McGookin and Stephen Brewster

"Similar studies [20] have been carried out on progress bars (...), where the user may wish to remain aware of an ongoing operation but not constantly visually monitor it. Beaudouin-Lafon and Conversey [4] proposed the use of Sheppard-Risset tones for auditory progress bars. (...) Unfortunately, Beaudouin-Lafon and Conversey did not evaluate their technique." (Page 353)

Chapter 18
Sonification for Process Monitoring
Paul Vickers


In all, four ecologies were constructed:
  1. Voice world— vocal speech labels;
  1. Sound effects world— beach noises: an auditory icon/soundscape set;
  1. Music world— tonal musical motifs: a structured earcon set;
  1. Rich world— a composite set of musical motifs, sound effects, and vocal messages.
Unfortunately, no formal studies have been published to discover how well the ecologies worked and which of the four was better received by users. (Page 479)


Obviously, not all research suggestions can be executed during the user studies. The major focus will lie on measuring the performance of sonification during a secondary task, also in comparison or addition the visual input. How context cues can be transported and comparing different ways through various sound design approaches will also be investigated. In that context, looking at the use of Sheppard-Risset tones to communicate statuses of processes will be evaluated. The observation of a sonification tool in a live working environment will not be part of the initial user studies. It is however still planned during later studies as part of this thesis. Investigating different ecologies as suggested in the "sonification for Process Monitoring" chapter will not be part of the user studies.

In conclusion, below are the metrics and topics that will be investigated during the user studies:

  • comparing performance, action, reaction and monitoring bandwidth with a sonification prototype for process monitoring while executing a second task (for different "data scenarios") in comparison to visual only approaches
  • investigating the use of different possibilities to transport context through sound (Sheppard-Risset tones a.o.)
  • Interview after user study to get detailed user feedback (fatigue, transition, notification level, disturbance, annoyance)

Friday, October 18, 2013

Calm Technology

"We have struggled for some time to understand the design if calm technology, and our thoughts are still incomplete and perhaps even a bit confused. Nonetheless, we believe that calm technology may be the most important design problem of the twenty-first century, and it is time to begin the dialogue."

As mentioned in a previous blog post, the article "Calm Technology" by Mark Weiser and John Seely Brown has been further investigated.

The paper describes the problems of today's information overload and how calm technologies could solve these problem, introducing a new way of presenting digital information to people. It is distinguished between a person's center of attention and periphery of attention, meaning "what we are attuned to without attending to explicitly." As an example, a car driver is described, and how he might not pay his entire attention on the car engine's noise constantly, but still be able to quickly recognize and maybe take immediate action once the sound changes. The ability to "move easily from the periphery of our attention, to the center, and back" is pointed out as a major attribute and advantage of calm technologies.

The attributes and abilities described to calm technologies in this paper are in line with the design vision for the "Listening to the Heart of Business" project. The information presentation is supposed to stay ambient and perceived only in a subtle way by the "periphery of our attention", but still be able to quickly catch our full attention when necessary. A related metric to this could be the so called notification level, often being described as a typical dimension of an ambient display taxonomy.

"It seems contra-dictionary to say, in the face of frequent complaints about information overload, that more information could be encalming. It seems almost nonsensical to say that the way to become attuned to more information is to attend to it less."
(...)
"As we learn to design calm technology, we will enrich not only our space of artifacts  but also our opportunities for being with other people. Thus may design of calm technology come to play a central role in a more humanly empowered twenty-first century."

Tuesday, October 15, 2013

Skype meeting with Supervisors

A second meeting took place with the two supervisors of this master project happening at the Hochschule Darmstadt. This time, the meeting took place via Skype from the Media Campus in Darmstadt/Dieburg and the DataShaka Office in London. Topics have been the classification of  metrics, taxonomies for ambient displays and sonification, user studies and kicking off of writing the actual thesis.

Following points are the major take aways and action:

  • identify and define possible intersections and transformations between the three metric classes
  • find or create own taxonomy for
    • Ambient Display
    • Sonification
    • => Ambient Auditory display
  • "What do I want to get out from my user studies?"
  • Start using Citavi
  • Create preliminary Table of content
  • add early content
  • Create a bibliography
Starting to write the actual thesis by beginning with a table of contents and filling in early content has the highest priority, directly followed by the organization of the user studies, as the results of these studies will feed largely into the thesis.


Thanks again two my supervisors for the great support of the project over such a long distance!

Monday, October 14, 2013

The Handbook of Sonification summary

The "Handbook of Sonification" has been read completely during the first research period of the master project. In the following days, all  notes and take aways from this extraordinary work about data sonification will be gathered and evaluated.

The book is structured into four main sections:
  1. Fundamentals of Sonification, Sound and Perception
  2. Sonification Technology
  3. Sonification Techniques
  4. Applications
Each section contains various chapters. Before the first section is an introduction, pointing out the potential of Sonification, the major vision of the field and gives suggestions how to read the book. Each section and their chapters will be evaluated in future blog posts.

The book provides a tremendous amount of information about data, sonification and psycho acoustics from a theoretical and practical perspective as well as practical evaluations of auditory displays. Moreover, very valuable information is given on the gaps that have not been covered by scientific researches yet.

Below is the full table of contents of the book, including the authors of each chapter:


1 Introduction
Thomas Hermann, Andy Hunt, John G. Neuhoff


I Fundamentals of Sonification, Sound and Perception


2 Theory of Sonification
Bruce N. Walker and Michael A. Nees

3 Psychoacoustics
Simon Carlile

4 Perception, Cognition and Action in Auditory Displays
John G. Neuhoff

5 Sonic Interaction Design
Stefania Serafin, Karmen Franinovi´c, Thomas Hermann,
Guillaume Lemaitre, Michal Rinott, Davide Rocchesso

6 Evaluation of Auditory Display
Terri L. Bonebright and John H. Flowers

7 Sonification Design and Aesthetics
Stephen Barrass and Paul Vickers


II Sonification Technology


8 Statistical Sonification for Exploratory Data Analysis
Sam Ferguson, William Martens and Densil Cabrera

9 Sound Synthesis for Auditory Display
Perry R. Cook

10 Laboratory Methods for Experimental Sonification
Till Bovermann, Julian Rohrhuber and Alberto de Campo

11 Interactive Sonification
Andy Hunt and Thomas Hermann


III Sonification Techniques


12 Audification
Florian Dombois and Gerhard Eckel

13 Auditory Icons
Eoin Brazil and Mikael Fernström

14 Earcons
David McGookin and Stephen Brewster

15 Parameter Mapping Sonification
Florian Grond, Jonathan Berger

16 Model-Based Sonification
Thomas Hermann


IV Applications


17 Auditory Display in Assistive Technology
Alistair D. N. Edwards

18 Sonification for Process Monitoring
Paul Vickers

19 Intelligent auditory alarms
Anne Guillaume

20 Navigation of Data
Eoin Brazil and Mikael Fernström

21 Aiding Movement with Sonification in “Exercise, Play and Sport”
Edited by Oliver Höner


Reading the "Handbook of Sonification" while commuting to work

Sunday, October 13, 2013

Source Control for first Prototype

Screenshot of the SourceTree project


To work more effective and secure on the prototype for the user studies in November, the code project of this prototype is now in source control. The software used is GIT and SourceTree. Every change to the prototype is now tracked and can be rolled back. A visualization in SourceTree shows all added features and every single commit to the code project. Also, it is now possible to amend to the same code from different machines and keep all devices up to date from the same source.

Wednesday, October 9, 2013

User Studies Planning Kick Off

To kick off the organisation of the user studies, a list of required items has been created and missing items have been identified.
Required days for the user studies are about 4-5 as the booking meetings with all prefered test persons will probably not be all possible on the same day.
For the interaction with the prototype, a laptop is required. To display graphs and visual feedback when required a second screen and a second laptop would be useful.
To play back sound, speakers are needed. Recording the studies visually, a camera needs to be installed and ways to record audio properly will need to be in place. Obviously, a room to hold those studies is required as well.

Meeting rooms are available for booking inside the office space. The bookings still have to be done. A personal laptop can be used for the user studies, a second one however will have to be organized. A large screen is available in every meeting room. For audio play back, speaker should be acquired and headphones should not be used, to later be able to easily evaluate the audio and video material. An audio recording device is available (Zoom H4), a video camera still has to be borrowed.

Here is the resulting list. Red marked items are not available yet.

  • 4-5 days time
  • 1st Laptop for interaction
  • 2nd Laptop and Monitor for graphs
  • Audio Speakers
  • Video Camera
  • Audio Recorder
  • Meeting Room

Monday, October 7, 2013

Ambient Technology Research

Further research has been conducted in the area of ambient information system. The major insights for this project are presented below, referring to the specific papers that have been examined closer so far.

Most works define Ambient Displays by referring to already existing work in this area. They mostly stress the aspect of visual ascetics and minimal data representations. It is also often mentioned, that the information of an ambient display should be non-critical, as for this type of data should be represented in a more detailed manner. This statement is standing a bit in contrast with the intended work of this project. Hence, it will be discussed and challenged.

The paper "Towards a Taxonomy for Ambient Information System" by Martin Tomitsch, Karin Kappel, Andreas Lehner and Thomas Grechenig from the Vienna University of Technology introduces the term "Ambient Information System", intending to broaden the horizon of ambient displays, as there are not only visual approaches to ambient technology and ambient information. The term "Display" however does not necessarily describe a visual display, but could also refer to others means of information representation, such as audible feedback for information as in an "Auditory Display". Still, broadening the area of Auditory Display from visually focused projects is very important and eye-opening,
Furthermore, the paper compares different taxonomies for the term "Auditory Displays" and concludes with their own taxonomy for auditory information systems:
"abstraction level, transition, notification level, temporal gradient, representation, modality, source, privacy and dynamic of input"
Additionally, various dimensions are identified, such as "Abstraction" or "Notification Level" (among others). The amount of abstraction mainly results how much the represented data has been aggregated and minimized. The notification level is the amount of times "a system alerts the user or even forces him to interrupt his primary task". (Adjusting and using this notification level in a smart way can possibly challenge the non-critical data aspect of Ambient Devices).

Here's a list of all dimensions being identified by the authors:
  • abstraction level
  • transition
  • notification level
  • temporal
  • gradient
  • representation
  • modality
  •  source
  • privacy
  • dynamic of input

The paper "Intrusive and Non-intrusive Evaluation of Ambient Displays" by Xiaobin Shen, Peter Eades, Seokhee Hong and Andrew Vande Moere from the University of Sydney and the University of Melbourne focuses on evaluation techniques for Ambient Displays:
"Intrusive Evaluation — is where the user’s normal behavior is consciously disrupted by the evaluation experiment. This kind of evaluation often consists of usability tests in a laboratory environment for a short period. Most such experiments are conducted using well established evaluation techniques in information visualization (for example, questionnaires and interviews)."
"Non-Intrusive Evaluation — is where the user’s normal behavior is not consciously disrupted by the evaluation experiment. This often focuses on actual use in a general environment (in situ) over a long period. Currently, few existing evaluation techniques can be applied successfully in this manner."
Furthermore, a practical user study is presented in high detail, providing very useful information. Two major conclusions are being stated at the end of the paper:

  • "Users need better support information from ambient displays"
  • "Non-intrusive evaluation cannot be tested until the display integrates into the environment."

Some of the papers mention the work "Designing calm technology" by Mark Weiser and John Seely Brown from 1995. This paper appears to be an important body of work dealing with the idea of ambient technology and will be investigated during further research. This paper can be found here.

The paper "Ambient Display using Musical Effects" by Luke Barrington, Michael J. Lyons, Dominique Diegmann and Shinji Abe from the University of California and the ATR Intelligent Robotics and Communication Labs in Japan mentions a particular practical work named "Audio Aura" which shows similarities with the planned ambient auditory display for DataShaka. This work will be investigated further. Their research paper can be found here.

Both works will be further investigated.

References

Barrington, L., Lyons, M., Diegmann, D. and Abe, S. n.p. Ambient Display using Musical Effects. [e-book] Electrical & Computer Engineering, University of California, San Diego & ATR Intelligent Robotics and Communication Labs, Kyoto, Japan. [Accessed: 2 Oct 2013].
Shen, X., Eades, P., Hong, S. and Vande Moere, A. 2007. "Intrusive and Non-intrusive Evaluation of Ambient Displays", paper presented at Pervasive '07 Workshop, Toronto, Ontario, Canada, 13 May. Toronto, Ontario, Canada: Pervasive '07 Workshop: W9 - Ambient Information Systems.
Tomitsch,, M., Kappel,, K., Lehner, A. and Grechenig, T. 2007. "Towards a Taxonomy for Ambient Information Systems", paper presented at Pervasive '07 Workshop, Toronto, Ontario, Canada, 13 May. Canada: Pervasive '07 Workshop: W9 - Ambient Information Systems.

Wednesday, October 2, 2013

Priorities

The online article "Postmortem of a Venture-backed Startup -  Lessons Learned from the rise and fall of @Sonar" that I have read recently, contains a particular sentence that made me reflect on the current planning of my master thesis:

You do not have 20% time. Identify your top three priorities. Throw away numbers two and three.

Putting this strategy to work, an hour has been spent on identifying the major priorities of the project and which would get the most valuable outcome for a successful research thesis:


  1. Holding a detailed user study with
    • early stage prototype
    • staged data
    • different user / user-groups
    • detailed recordings and evaluation
  2. Having a fully working application to
    • present
    • deploy
  3. Deploying an application inside a live business environment to
    • observe worker using the piece
    • evaluate the additional value to the business
    • prove the concept

Afterwards, priorities two and three have been excluded.


As hard as this proactive decision is, it is a valuable thing to do and important to focus on the one and most important priority for the project.

The really interesting article can be found here.

Finally, here's another famous quote that can also be found in this article: 

“Focus is saying no to 1,000 good ideas.” — Steve Jobs

Sunday, September 29, 2013

Ambient Devices

Ambient devices are generating ambient information that is to be perceived subconsciously. Their major purpose is to remain in the background and only catch a persons attention when important events are happening.

Ambient information is reduced to the core information of the data and ambient devices are transmitting this minimal information in a subtle way. This way, the amount of concentration required to monitor particular processes or values is reduced enormously.  

Clive Thompson from the New York Times wrote an article about ambient information in 2002 investigating how ambient displays will change the way we perceive data:
'The ultimate goal is to tame our information so it no longer frazzles. Instead, it creates ''calm and comfort,'' as the computer scientists Mark Weiser and John Seely Brown wrote in a prophetic 1996 paper on ambient information, ''The Coming Age of Calming Technology.''Consider how counterintuitive this is. We've been cramming stock tips, horoscopes and news items onto our computers and cellphones -- forcing us to peer constantly at little screens. What if we've been precisely wrong? It's the new paradox of our data world. ''The way to become attuned to more information,'' Weiser and Brown noted, ''is to attend to it less.'''
Characteristics of ambient displays and the qualities of the auditory display being created during this research project are very much alike and every attribute can be interpreted acoustically as well as visually.

A practical example is the Stock Orb by Ambient TM, which emits light to display information. Changing parameters of this light that are mapped to the data are the light's color, intensity and pulsing frequency.

Product Picture of the Stock Orb by Ambient TM

All these attributes can be transferred and implemented on a sine wave from a tone generator as well. Keeping in mind that sound and light are both waves that are just in entirely different frequency ranges, creating an ambient display based on sound instead if light with the same characteristics and qualities does not appear far-fetched.

As the requirements to the planned auditory display and its purpose in the working environment are very similar to the ones of an ambient device, investigating and evaluating the modes of operation of various ambient displays and ambient devices in general is vital for the project and the implementation of the physical prototype inside DataShaka's office space. The prototype must align with the classic requirements and features of an ambient device and will be challenged as such.
The implemented sonification system will be functioning as an Ambient Auditory Display.

Hence, apart from sonification, a major research focus lies on ambient devices. Below is a collection of important papers and sources that are further investigated.


Towards a Taxonomy for Ambient Information Systems 

by Martin Tomitsch , Andreas Lehner , Thomas Grechenig 
We propose a set of design dimensions that constitute the axes of a taxonomy for ambient information systems. The dimensions are based on an investigation of a wide range of research projects and related papers. We rank 19 ambient information systems on each axis to demonstrate the utility of the taxonomy. We further discuss other similar taxonomies and compare them to our approach.


Evaluating the comprehension of ambient displays

by Lars Erik Holmquist 
We introduce an evaluation framework for ambient displays, with three levels of comprehension: that data is visualized; what is visualized; and how it is visualized.

Evaluating an ambient display for the home

by Sunny Consolvo, Jeffrey Towle
We present our experiences with evaluating an ambient display for the home using two different evaluation techniques: the recently proposed 'Heuristic Evaluation of Ambient Displays' and an in situ, 3-week long, Wizard of Oz evaluation. We compare the list of usability violations found in the heuristic evaluation to the set of problems that were discovered in the in situ evaluation. Overall, the 'Heuristic Evaluation of Ambient Displays' was effective - 75% of known usability problems were found by eight evaluators (39-55% were found by 3-5 evaluators). However, the most severe usability problem found in the in situ evaluation was not identified in the heuristic evaluation. Because the problem directly violated one of the heuristics, we believe that the problem is not with the heuristics, but rather that evaluators have minimal experience with ambient displays for the home.

Ambient Display using Musical Effects

by Luke Barrington ,Michael J. Lyons ,Dominique Diegmann ,Shinji Abe
The paper presents a novel approach to the peripheral display of information by applying audio effects to an arbitrary selection of music. We examine a specific instance: the communication of information about human affect, and construct a functioning prototype which captures behavioral activity level from the face and maps it to musical effects. Several audio effects are empirically evaluated as to their suitability for ambient display. We report measurements of the ambience, perceived affect, and pleasure of these effects. The findings support the hypothesis that musical effects are a promising method for ambient informational display.


References
___________________________
Thompson, C. 2002. News That Glows. New York Times, 15 December.
Ambientdevices.myshopify.com. 2013. Ambient Devices. [online] Available at: http://ambientdevices.myshopify.com/ [Accessed: 28 Sep 2013].