The abstract, table of contents and introductory chapter of the thesis is below. If you're interested in full thesis, please let me know and I will send it to you! Also very excited to hear any comments or feedback on the project!
LISTENING TO THE HEART OF BUSINESS
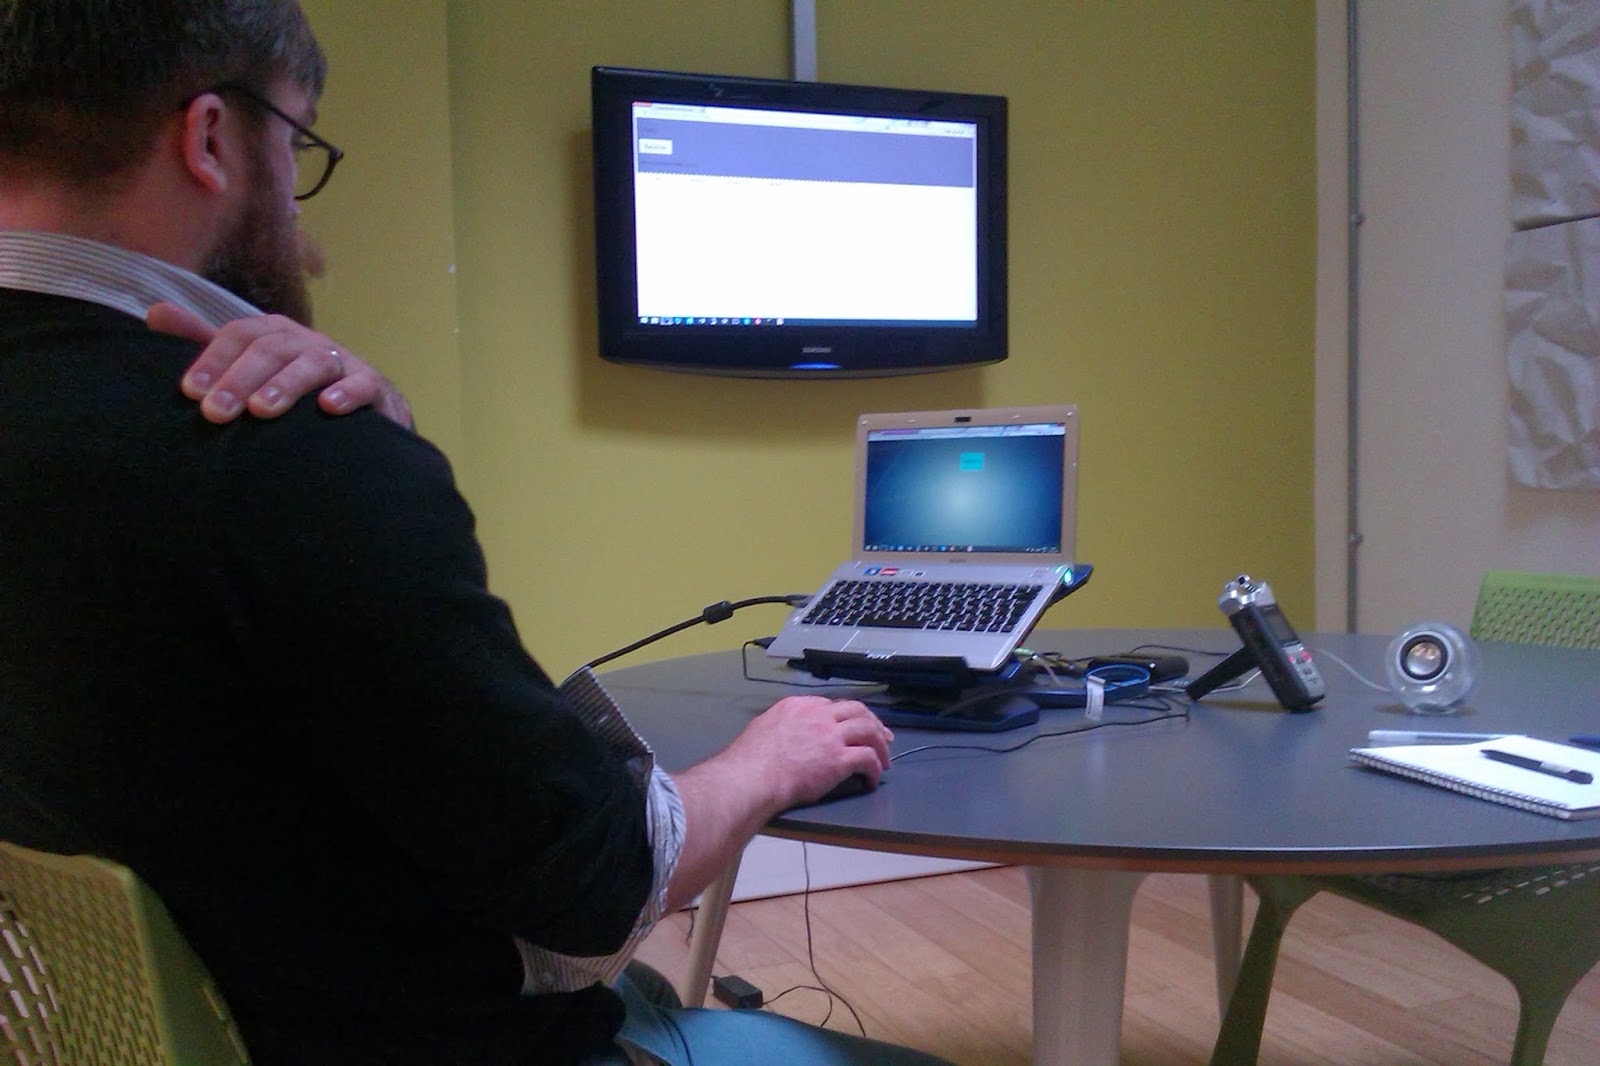
by Clemens Anzmann at the DataShaka Ltd. officeIntroduction
Ambient Auditory Displays
- Definitions
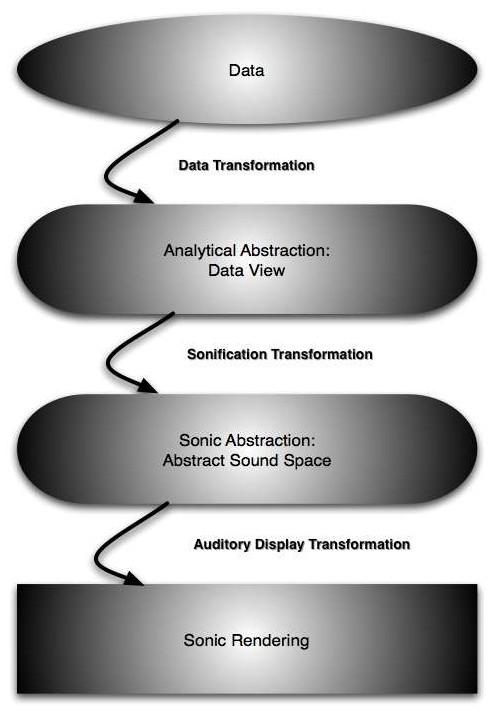
- Sonification
- Ambient Display
- Taxonomy and Dimensions
- Related Projects
Concept
- Metric Classification and Manipulation
- Sound Design
Implementation and Evaluation
- Technical Research
- Company Internal Research
- User Studies
- Intrusive User Studies
- Non-Intrusive User Studies
- Observational Methods
- Reports and Evaluation
- Retrospective
Outlook and Conclusion
References
Abstract
Every business today generates data through its everyday processes. The look of this data might vary, depending on the nature of the company. However, they all equally produce data. This data can, if used correctly, provide valuable information and crucially support important decision making. In fact, no decision should be made and no action should be taken that is not data driven or justifiable and backed up with data. This is commonly achieved through the continuous tracking of all business metrics and their retrospective analysis. A different approach is to continuously observe these metrics in real time, to gain a constant awareness on their development and the ability to take quicker action when necessary. The main goal of the “Listening to the Heart of Business” project was to develop and evaluate techniques and applications that produce ambient data sonification to provide non-disruptive data monitoring of business relevant data inside a working environment. Office workers should only be distracted from their main task when critical events occur. The “Listening to the Heart of Business” project states that the use of ambient auditory displays will enable companies to subtly stay on top of their data as well as empower them to take immediate action a lot faster when necessary. The hypothesis, ambient sonification would not add value to the awareness of business relevant metrics has been challenged through research in the fields of ambient displays and auditory displays as well as several user studies and their evaluation, including the implementation and evaluation of an auditory display inside a working environment. All research has been conducted at the DataShaka Ltd. office in London.1. Introduction
Today’s companies are facing classic big data problems when trying to observe and evaluate their internal data. With the ability to track almost everything that is happening inside and outside the company, people are lacking tools to observe all these relevant metrics for continuous awareness and faster data driven decision making. The three major challenges in big data (also commonly known as the three V’s) are volume, velocity and variety [25]. Regarding the growing amount and accelerating shifts in internal and external metrics, it is especially the problem of volume and velocity that businesses have to cope with. With the overwhelming amount of data that can have a potential impact on the business, the desire to act proactively is challenged as these large amounts of data can only be consumed retrospectively.Particular data representation devices that addresses the problematic of information overload are so called ambient displays. Ambient displays destruct data to its most basic information to transmit this information in ways that can be subtly perceived by its observer. A common example for ambient displays are lights that are smoothly changing colour or intensity in relation to the data stream they represent. The major goal of ambient displays is to minimize the mental effort of the observer to monitor the data stream and present data in a non-disruptive way.
For situations where it is not convenient for the observer to be continuously distracted by a visual display, auditory displays are a suitable solution to provide information without the necessity of visually focusing on a particular artefact, as “unlike visual perception, perception of sound does not require the listener to be oriented in a particular direction.” [22] Most current practical applications of auditory displays for these situations use a classic alarm-focussed approach and often trigger highly disruptive sounds.
A classic example for these types of auditory displays deployed for such use cases are alarms in stores triggered by a sensor that identifies stolen items. Disruptive auditory alarms can also be found in pilot cockpits, signalling critical values of several instruments. Furthermore, a common deployment of auditory displays is found in hospitals for the continuous observation of vital signs of numerous patients. Usually, the loudspeakers and sounds are specifically designed to make a strong noise audible on very sensitive frequencies.
When looking at current problems and needs companies are facing due to their high data volume and velocity and comparing it to the use cases ambient and auditory displays are trying to solve, it appears that ambient displays and auditory displays both address and potentially satisfy different aspects of these needs. To elaborate and present their potential for this use case, the following research project investigates ambient and auditory displays and their effective use in working environments to enable company personnel to have a permanent awareness over business developments without being distracted from their everyday work. It furthermore investigates the term “Ambient Auditory Display” and proposes a taxonomy. User studies and a live deployment of a prototype in a working environment have been conducted. The prototype has been evaluated in regards to the proposed taxonomy. Evaluations and conclusions have been conducted after the successful completion of all user studies.
To structure the limited research time and define goals and deadlines for the research period (September 2013 until February 2014), a detailed Gantt chart had previously been created. The outlined strategy on the chart had been evaluated and restructured continuously and went through different iterations during the research period. The following paragraphs presents the final version of the Gantt chart that can be found in appendix A.
During the first month, completing the technical research to produce potential sonification prototypes and create initial sketches and tests have been the main focus. At the end of the second month, a preliminary sonification prototype created from these sketches was planned to be ready and able to process and present a data stream. Simultaneously, it was planned to conduct all necessary theoretical research within the first two months. During the third month, user studies had been scheduled. Evaluating and structuring all results was timed to be completed by the end of the month, so the development of a second prototype respecting all results from the previous user studies could be started. During December, this new prototype was scheduled to be deployed in a live working environment, to be evaluated at the end of the month. The completion of the presentation and writings of all the noted results from both user studies in the written documentation was set for the end of January. Additional stretch goals had been defined for each month.
All research has been conducted at the DataShaka office in London. DataShaka Ltd. is a data unification platform specialised to solve the variety problem in big data. As the volume problem has become manageable with decreasing prices for digital storages, variety is now a major problem in big data and companies have strong desires to be able to have all data in one place. All internal and external business relevant data comes in various different formats and all datasets are structured differently, depending on their content. DataShaka is solving this problem for their clients by harvesting and unifying all of their client’s data in an agile data format. Many internal metrics exist, that require observation and attention by employees of DataShaka. Ambient auditory display prototypes have been evaluated, by testing and deploying them inside the DataShaka office. Data from occurring events, feedback as well as scheduled interviews with DataShaka personnel has been gathered for additional evaluation.
The following body of work presents the research project “Listening to the heart of business” and its results. In chapter 2, definitions for the terms ambient display, auditory display and data sonification are derived and a taxonomy is proposed for the term “Ambient Auditory Display”, combining the attributes of these data representation approaches. Related projects are investigated and compared. Chapter 3 describes ways to simplify and extract valuable information from raw company metrics. Furthermore, sound design approaches for data sonification are discussed. Further on, chapter 4 presents all user studies that have taken place during the research period. Technical research in the area of data sonification achieved through online applications using JavaScript libraries is propounded. A detailed description, report and evaluation of all user studies is further presented and future research paths are being discussed.