Thursday, November 28, 2013

Choir.io

"Listing to the Heart of Business" tries to find ways to give businesses a peripheral awareness over their data. Chior.io is a project that takes a very similar approach of presenting continuous data flows:

Chior.io is a web based service to allow to monitor processes acoustically, to provide "ambient awareness  without effort" [1]. Through an API, events can be streamed to the service which turns those events into sound. Defining those events happens by the user in the back end. Different languages are documented to send events to chior.io, such as Shell languages, Python, Ruby, Node.Js, PHP, C#, Java and Clojure. The resulting sonification is available online and therefore can be accessed from any machine. 

The sound design is given by chior.io and specifies three different event types: good, neutral and bad. Two different sound sets are available ("submarine" & "bloob"). 


Sounds available for the three emotions given by choir.io


It seems that individual sound design is not yet possible to implement. All auditory events appear to be static and sound icons don't seem to be able to change dynamically to an events' severeness. Hence, all events are technically treated as binary events. 

An impressive example and prove of concept is available on the project's website: A live sonification of GitHub events.

GitHub events sonification by choir.io


References

1. Choir.io. 2013. Choir.io. [online] Available at: http://choir.io/ [Accessed: 28 Nov 2013].

Tuesday, November 26, 2013

Interview with a DevOps

An interview with the person responsible for DevOps has taken place at the DataShaka office.

Main questions during the interview where what the term DevOps means, how it is related to the agile movement, how it is different from classic operations and what are the tools currently available.

One topic during the interview was the agile moving, where the term DevOps emerged from. One major drive in the agile movement was to bring developers closer to people, rather than having them isolated inside the company. Similarly, the DevOps movement intends to bring developers and operations closer, as both departments used to be quite separate. In larger companies, entire DevOps teams are now responsible to link development and operations together (also see previous blog post here).

Software being used by operations or DevOps have been mentioned:
  • Etsy
  • Stats D
  • DataDog
  • SNMP
A term mentioned very often during the interview was "pro-active". It is important for a person responsible for DevOps, to be pro-active rather than re-active. This means specifically, to be able to interfere before something breaks and to be able to act with hindsight. Practically (and already in acoustically) speaking, it means reacting early to strange noises rather than to the alarm noise, when it is already too late.

There seems to be a lot of interesting history about operations and it appears that this field of work is still facing similar problems as it used to have in the past. With the ability to monitor all the things simultaneously in real-time, operations is facing classic big data problems, such as volume and/or velocity. Additionally, operations as well as DevOps departments want to be able to act pro-actively, interfere before things breach and provide a non-disruptive service. With the rising amount of data, this desire is challenged by what is often referred to as the "bandwidth problem". Not resolving this problem, will ultimately this hinder scaling. And therefore, better tools will be needed for DevOps departments.

The content and information received during this interview has been of very high value for the research project as the challenges faced by the DevOps sector match entirely with what the "Listening to the Heart of Business" project is trying to solve: Being able to be on top of a large amount of metrics with minimal disturbance of your primary task.

---------------------------------------------------------------------------

Below can be find excerpts from the interview that have been found as particularly valuable:

"DevOps introduced a numbers of new tools, processes and operations bringing operations into the twenty-first century"

"[It's about] making sure things are pro-active, not re-active"

"monitor everything"

"People have an expectation now, that things will just work all the time. That means you need to be an top a lot more."

"You need to be able monitor a lot of things at one time with through a limited amount of real estate."

"We can see broad brushes, we can see if something broken or if something stopped, but actually getting this pro-activity of 'is it operating well, how is operating' is difficult, because the bandwidth is lower."

"You might have an ambient display for temperature alarm. (...) You wouldn't have an ambient display for a fire alarm. (...) A fire alarm is designed to disrupt you."

"People don't make enough use of non-disruptive monitoring. That's what pro-activity is about. (...) Pro-activity is the understanding and having the nuance to be able to dig into what's happening before it's a problem and before it's breaching."

"It's also a scaling problem. You suddenly got that need to monitor much more than you're able to perceive. You need to be on top of an awful lot of stuff. And that's when people start to look into different ways of data presentation rather than purely a number. What can we do to help increase that leverage? For large organisations, it's about being able to get that higher bandwidth."
"The ingenuity of human brains and look at a problem and find a lateral solution is always going to be involved. What it is is about giving humans better tools."

Wednesday, November 20, 2013

User Studies Data Analysis

The data collected from the first user study has been harvested and analysed. First thing that comes to eye is, that there do not appear to be many clear differences in the data and it will be difficult to extract valuable information or conclusions, due to the fairly small sample size.

Initially, the performance over time while keeping track of moving metrics has been examined. When comparing the average performance of users working with the visual only approach to the sound approaches, no clear performance increase can be identified. There appear to be performance differences between users working with the "sound alarm only" and the "sound alarm and audification" approach. However, the small sample size does not allow to draw a solid conclusion from this.


In all cases, the performance decreased in a fairly similar amount when an event occurred. Though there where performance differences between each user, the average performance decrease while fixing events was fairly consistent. A notable issue in the data is however, that performances with the visual approach showed a  more consistent performance whereas the audio approaches showed more fluctuations.

A non-intrusive evaluation with a similar prototype installed in a live office environment is planned. This way, the factor time and surprise would take a larger role, as users would not constantly expect event to occur and fully concentrate on their primary task.


In the context identifying tests of auditory alarms, artificial sound design approaches appeared to be clearly more identifiable then recordings of natural sounds. 16 different sound alarms where triggered, eight of them being natural and the other eight being artificially created sounds.

Amount of users guessing context correctly for each context type separated by natural and artificial sounds


Artificial sounds appeared to be more familiar to users whereas natural sounds often caused surprise, confusion or where sometimes completely ignored. 76% of the artificial sounds where referred correctly to what the sound designer intended the sound to represent, whereas only 24% of the naturally recorded sound's context was identified.


This outcome is very insightful and will be further investigated. The focus on further investigations will lie on artificial sounds and different techniques how to transport context.


The analysis of transcript of the interviews is still work in progress.

Sunday, November 17, 2013

DevOps

"DevOps is a response to the growing awareness that there is a disconnect between what is traditionally considered development activity and what is traditionally considered operations activity. This disconnect often manifests itself as conflict and inefficiency."
-- Damon Edwards, "What is DevOps?" [1]

In agile business environments, DevOps teams are often responsible to ensure change and stability, and most importantly deal with the conflict that lies within those two areas. The term DevOps is put together from the two terms "Development" and "Operation", which are two classic departments in software companies. Development is responsible for all amendments, bug fixes and constant further development of the software. Operations is responsible for the software's stability. Both departments have interest that often conflict. The area around DevOps is supposed to solve this conflict and bring back agility to the static and sluggish current "Development - Operations" structure, which is continuously blocking itself.

Image from Dev2Ops.org

To ensure constant stability without constantly being distracted with monitoring and still being able to remain agile and open to change, new ways of metric measurements are necessary. 
Therefore, a major part of the DevOps movement is related to metric monitoring of so called KPIs (Key Metric Indicators) [3].
Ambient displays and Auditory Displays inherit potential to benefit for DevOps teams, as they provide a constant peripheral awareness of important metrics but are not necessarily a continuous distraction. 
DevOps is an area the research project could make a major contribution to and it proves to be a potential use case for the deployment of an ambient auditory display.


Image from Dev2Ops.org

Further research will be conducted through organizing an interview with the person responsible for Lead DevOps at the DataShaka office. After the evaluating the interview, installing an ambient auditory display triggering subtle sound events will be the next priority. Its impact on employees, operations and development as well as the office space in total will be evaluated.


References:


  1. dev2ops. 2013. What is DevOps? - dev2ops. [online] Available at: http://dev2ops.org/2010/02/what-is-devops [Accessed: 17 Nov 2013].
  2. Hüttermann, M. 2012. DevOps for developers. [New York]: Apress.
  3. Reh, F. 2013. Key Performance Indicators or KPI. [online] Available at: http://management.about.com/cs/generalmanagement/a/keyperfindic.htm [Accessed: 17 Nov 2013].

Wednesday, November 13, 2013

First User Study Session

The first user study has been conducted at the DataShaka office. Six individuals have been tested using two different prototypes with different settings while executing a primary task. The user group consisted of five male and one female person between 27 and 49 years of age. All reported normal hearing abilities. All participants work with computers on a daily basis on a similar amount of time.

The studies took place in a lab with a size of 16 square meter, equipped with a large round table, several chairs, a large screen on the wall, one laptop mounted on a stand, speakers and an audio recording device.

The approach to the evaluation of the prototypes was an intrusive evaluation, "where the user’s normal behavior is consciously disrupted by the evaluation experiment", as described in the  paper "Intrusive and Non-intrusive Evaluation of Ambient Displays" by Xiaobin Shen, Peter Eades, Seokhee Hong and Andrew Vande Moere.

The primary task consisted of a simple mouse clicking game, where the user had to follow a box on the screen and click it. The amount of clicks every 10 seconds had been recorded to have a unit to measure the user's performance. While executing this task, users had to monitor four different metrics that where represented in different ways:
  • visual representation only
  • sound alarms only
  • sound alarms and metric audification
Every time, one of the metrics exceeded a particular threshold, users had to interrupt their primary task and switch to the other screen to resolve the issue (by clicking a appearing button).


The visual only data representation of the four metrics was represented on the large screen mounted to one of the walls of the lab. The screen was clearly visible from the position. Once a metric exceeded a particular threshold, a large red bubble would appear on the screen. Additionally, all four metrics where visualized by a bar chart.

The "sound alarms only" approach would only trigger a alarming noise once a value exceeded a particular threshold.

The "sound alarms and metric audification" approach contained the alarming noise as well as four different wave and noise generator mapped to the four values. Through that, users could constantly hear the values and the value's changing.

Every user went through two of these three settings after a short warm up with the application. The sound approaches where always prior to the visual only approaches.


In the second setup, several different auditory icons and earcons where played. Users had to decide for each alarm sound what context it might inherit. There where four different solutions:
  • Data In
  • Data out
  • Process Step Complete
  • Process Step Failed
Different design approaches have been tested and evaluated through this method.

After interacting with the prototypes, users have been questioned during an interview about their experience.


References

Shen, X., Eades, P., Hong, S. and Vande Moere, A. 2007. "Intrusive and Non-intrusive Evaluation of Ambient Displays", paper presented at Pervasive '07 Workshop, Toronto, Ontario, Canada, 13 May. Toronto, Ontario, Canada: Pervasive '07 Workshop: W9 - Ambient Information Systems.

Thursday, November 7, 2013

Table of Contents

A preliminary table of contents for the written thesis has been created:

_________________________________________________

  1. Abtract
  2. Introduction
    1. Project Description
    2. Goals
    3. Summarize Thesis
  3. Sonification
    1. Definition
    2. Techniques
  4. Ambient Display
    1. Definition
    2. Calm Technology
  5. Ambient Sonification
    1. Introduce
    2. Taxonomy and Dimensions
  6. Related Project
  7. DevOps
    1. What is DevOps
    2. Agile
    3. Challenges
  8. Data and Metrics
    1. Classification
    2. Time Series Data
    3. Agregation
  9. Sound Design
  10. The Heart of Business
    1. Project Idea and explanation
    2. Approach
    3. Research
    4. User Studies
    5. Evaluation
    6. Live Implementation
    7. Evaluation
  11. Discussion
  12. Conclusion


Wednesday, November 6, 2013

User Studies Procedure

Now that the goals of the user studies are defined, the procedure, tasks and content of the user studies is created to achieve these goals.

The studies will consist of three parts per person:
  • Sonification versus Visualization
  • Transporting Context through Sonification
  • Interview
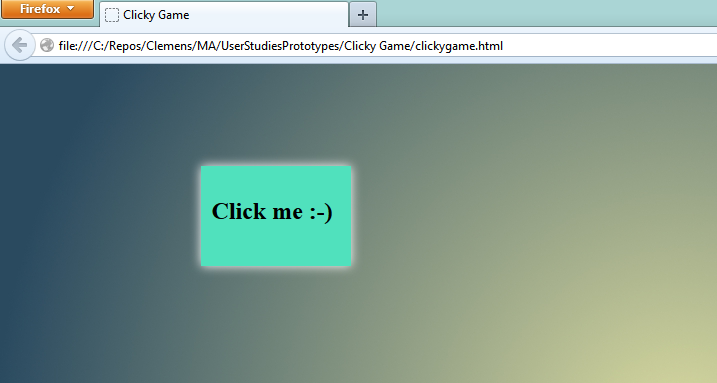
In the first step, the user will perform a basic task on a notebook while the amount of clicks per minute/second is recorded. A large screen in the room displays a constant data stream visualized through a bar chart. Another data stream is sonified through parameter mapping. When one of those streams exceed a certain threshold an event will be triggered, either visually or audible. Once an event occurs, the user has to interrupt the primary task and respond to the event.
The user will be given the option to switch off the parameter mapping or sound icons. How many users chose to actively mute one of the sounds and especially which one of those two sounds will be part of the evaluation.
Furthermore, the reaction time differences and the impact on the primary task will be evaluated. The amount of data streams for visual and audio representation will increase over time. That way, the maximal bandwidth of user for audio and visual data representation can be determined and compared. It has yet to be decided, weather the audio and visual test will be held separately or  in combination by having both merged into on test.

In the second step, the setup of the previous test remains. The large screen however won't be showing any visualizations and only audio will be played. The user has to perform a simple task while events occur, being represented through different earcons and auditory icons. Various approaches will be tested to transport context through these notifications, as the user has to guess the context around the event that happened.
Zachary Pousman and John Stasko identified four different semiotic approaches to information representation design for ambient displays in their work "A Taxonomy of Ambient Information Systems: Four Patterns of Design": indexical, iconic and symbolic. Symbolic signs are signs that have to be learned and cannot be understood immediately. Iconic signs are more insightful and could be identified at a glance as the way they are presented is clearly connected to what they stand for. Indexical signs are directly connected to their signified item, such as a photography of signified item. All three semiotic approaches will be tested to investigate and evaluate their effectiveness of transporting context cues through sound.
There are only four different events that can occur and the user only has to decide, which one it is. Through the different amounts of accuracy, the different semiotic sonification approaches can be evaluated.
Furthermore, this study will try to investigate ways to combine auditory icons and earcons in a meaningful way. As pointed out in the chapter "Earcons" by David McGookin and Stephen Brewster in the Sonifcation Handbook, "less work has been carried out to see how they can be best combined within an interface."

After those two tests, the user will be interviewed to gain knowledge about the entire experience and user feedback. Main points during this interview are a.o. fatigue, disturbance or annoyance.